Unleash the Power of Data Visualization
Expert Power BI design and custom visual development that transforms complex data into compelling business insights.
When native charts fall short
P&L, balance sheets & cash flow with drill-through — beyond native visuals.
Out-of-the-box charts rarely match your corporate visual identity.
Manufacturing, healthcare & logistics need unique, purpose-built visuals.
Drag-and-drop, real-time updates & complex cross-filtering — not natively possible.
Native visuals struggle with large datasets and enterprise-scale deployments.
Our Services
We don't just build dashboards — we architect data-driven decision systems
Power BI Full-Stack Design
End-to-end solutions from data warehouse to report delivery
- Data Modeling & Architecture
- DAX Optimization
- Enterprise-Grade Solutions
Custom Visual Development
Breaking the limits of native charts with bespoke solutions
- D3.js / Power BI SDK Development
- Fully Customized Interactions
- Brand-Aligned Visual Identity
Power BI Consulting & Design
We provide complete services from scratch to production deployment
Data Layer
Data Warehouse / Data Lake architecture, incremental refresh strategies
ETL Layer
Power Query transformations, multi-source data integration
Modeling Layer
Star/Snowflake schema, high-performance DAX measures, RLS implementation
Presentation Layer
Corporate VI-compliant design, mobile-responsive layouts, performance tuning
Visuals Built Beyond Limits
Bespoke visualizations tailored to your exact requirements
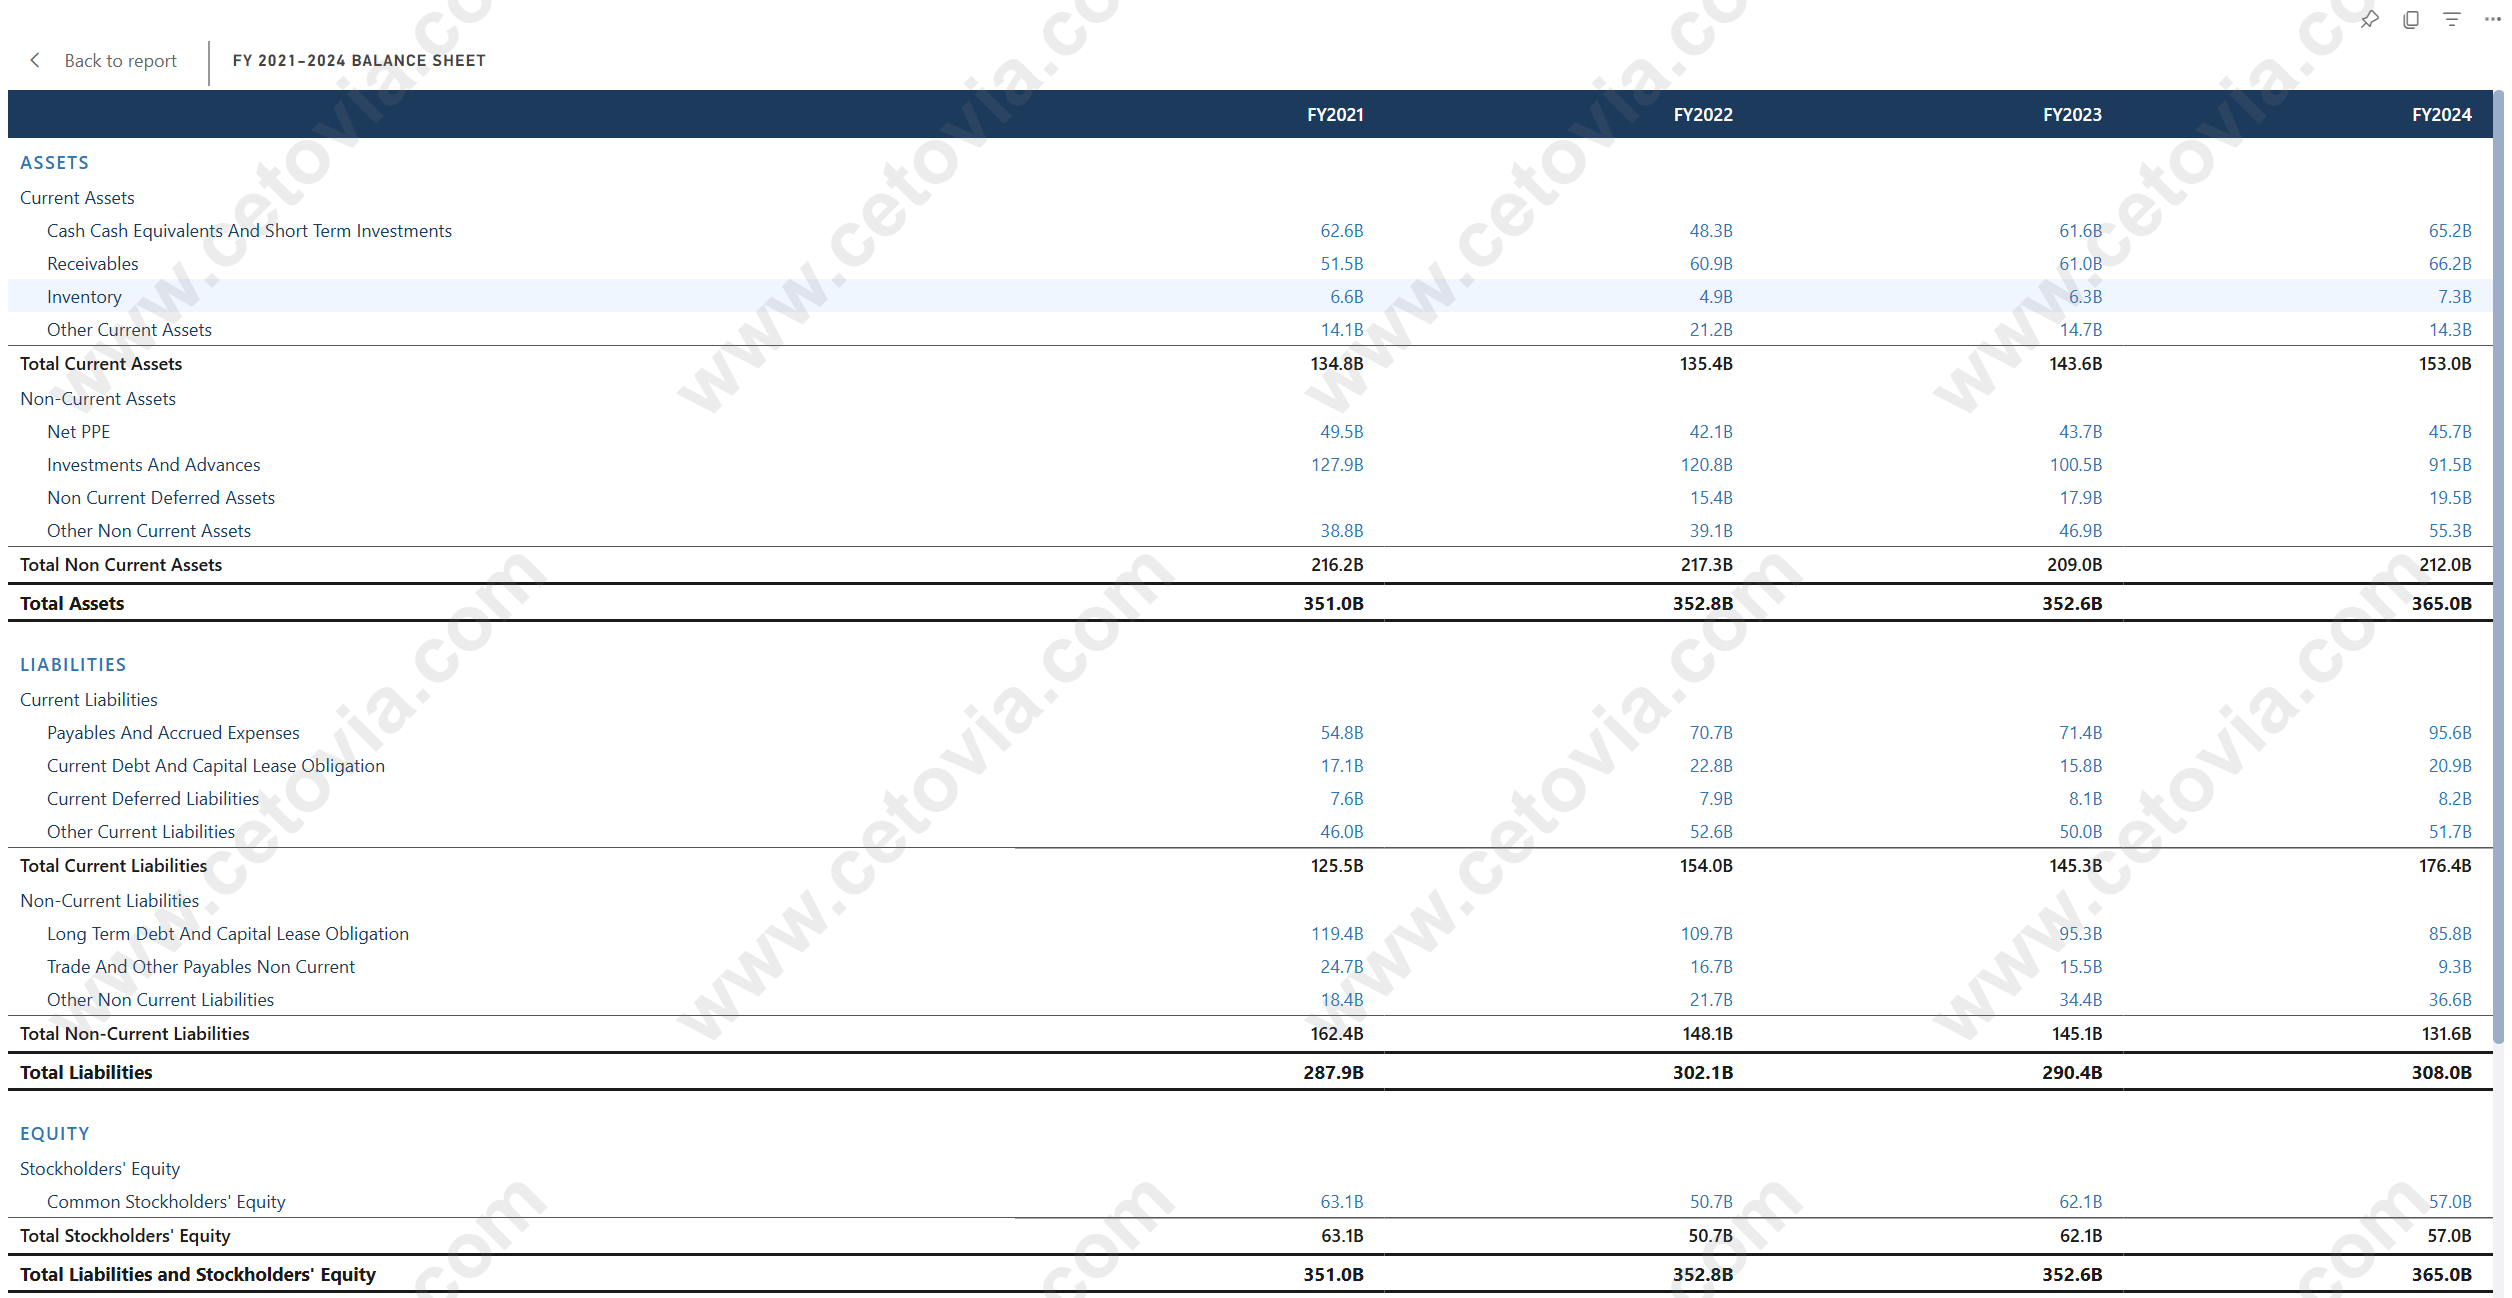
Financial Three-Statement Model
Integrated P&L, Balance Sheet, and Cash Flow with full drill-through
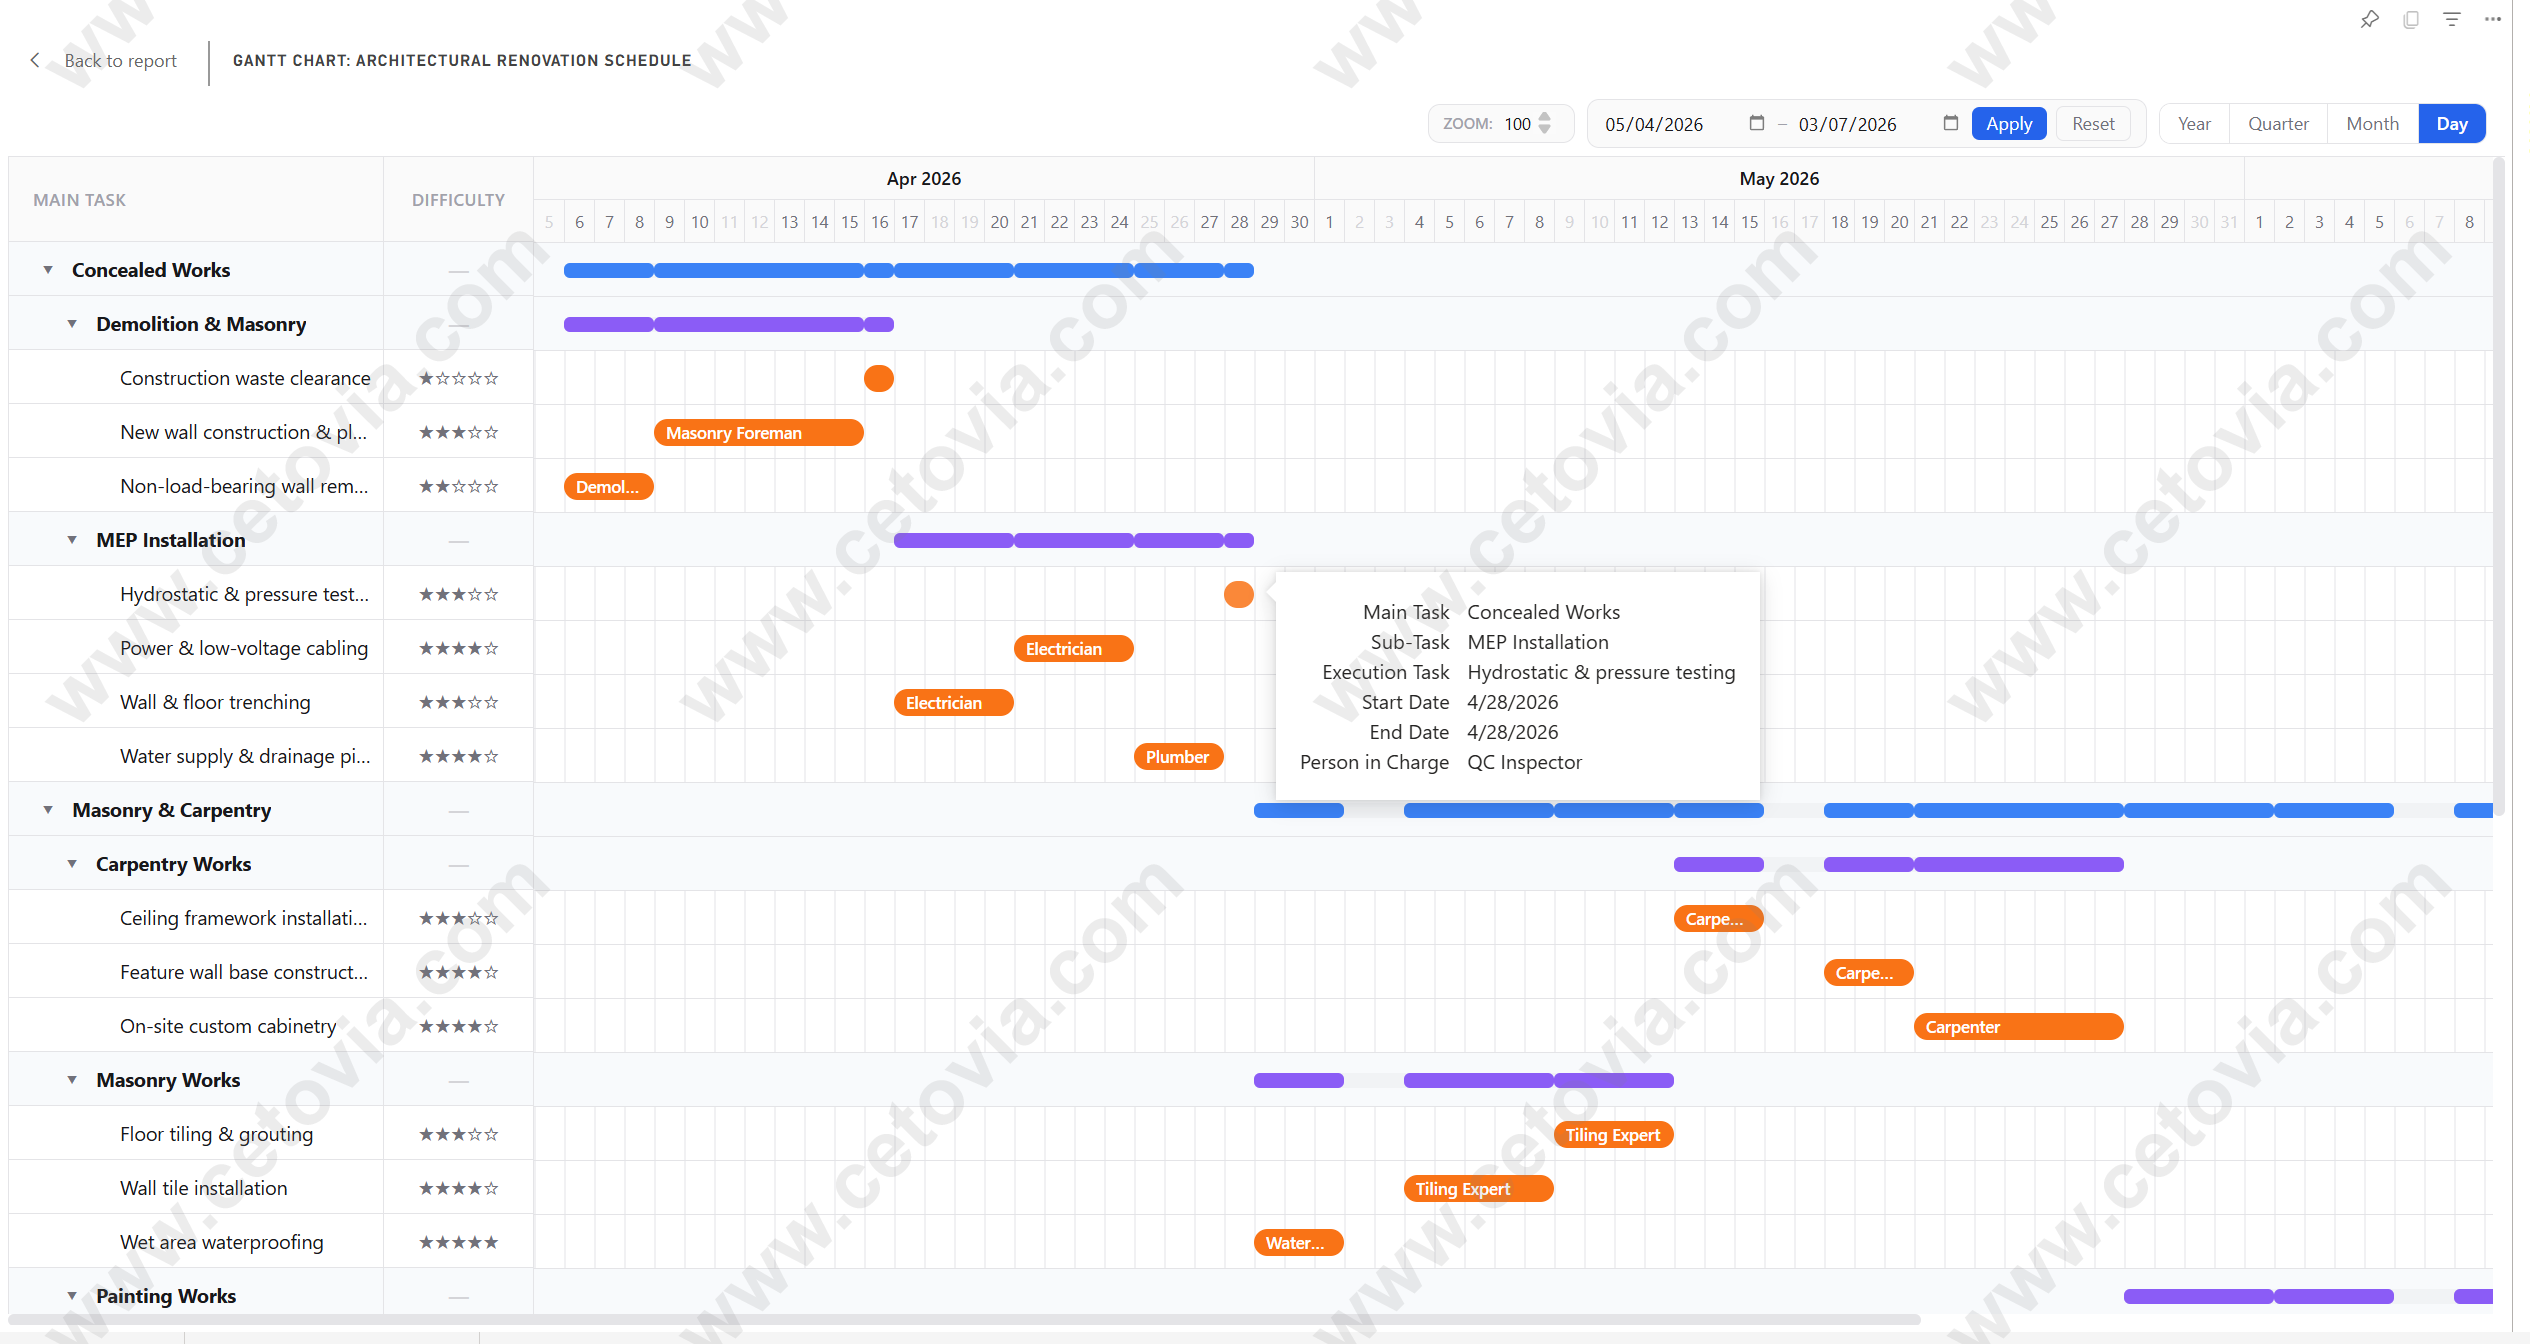
Gantt Chart Timeline
Interactive project timeline with dependencies and milestones
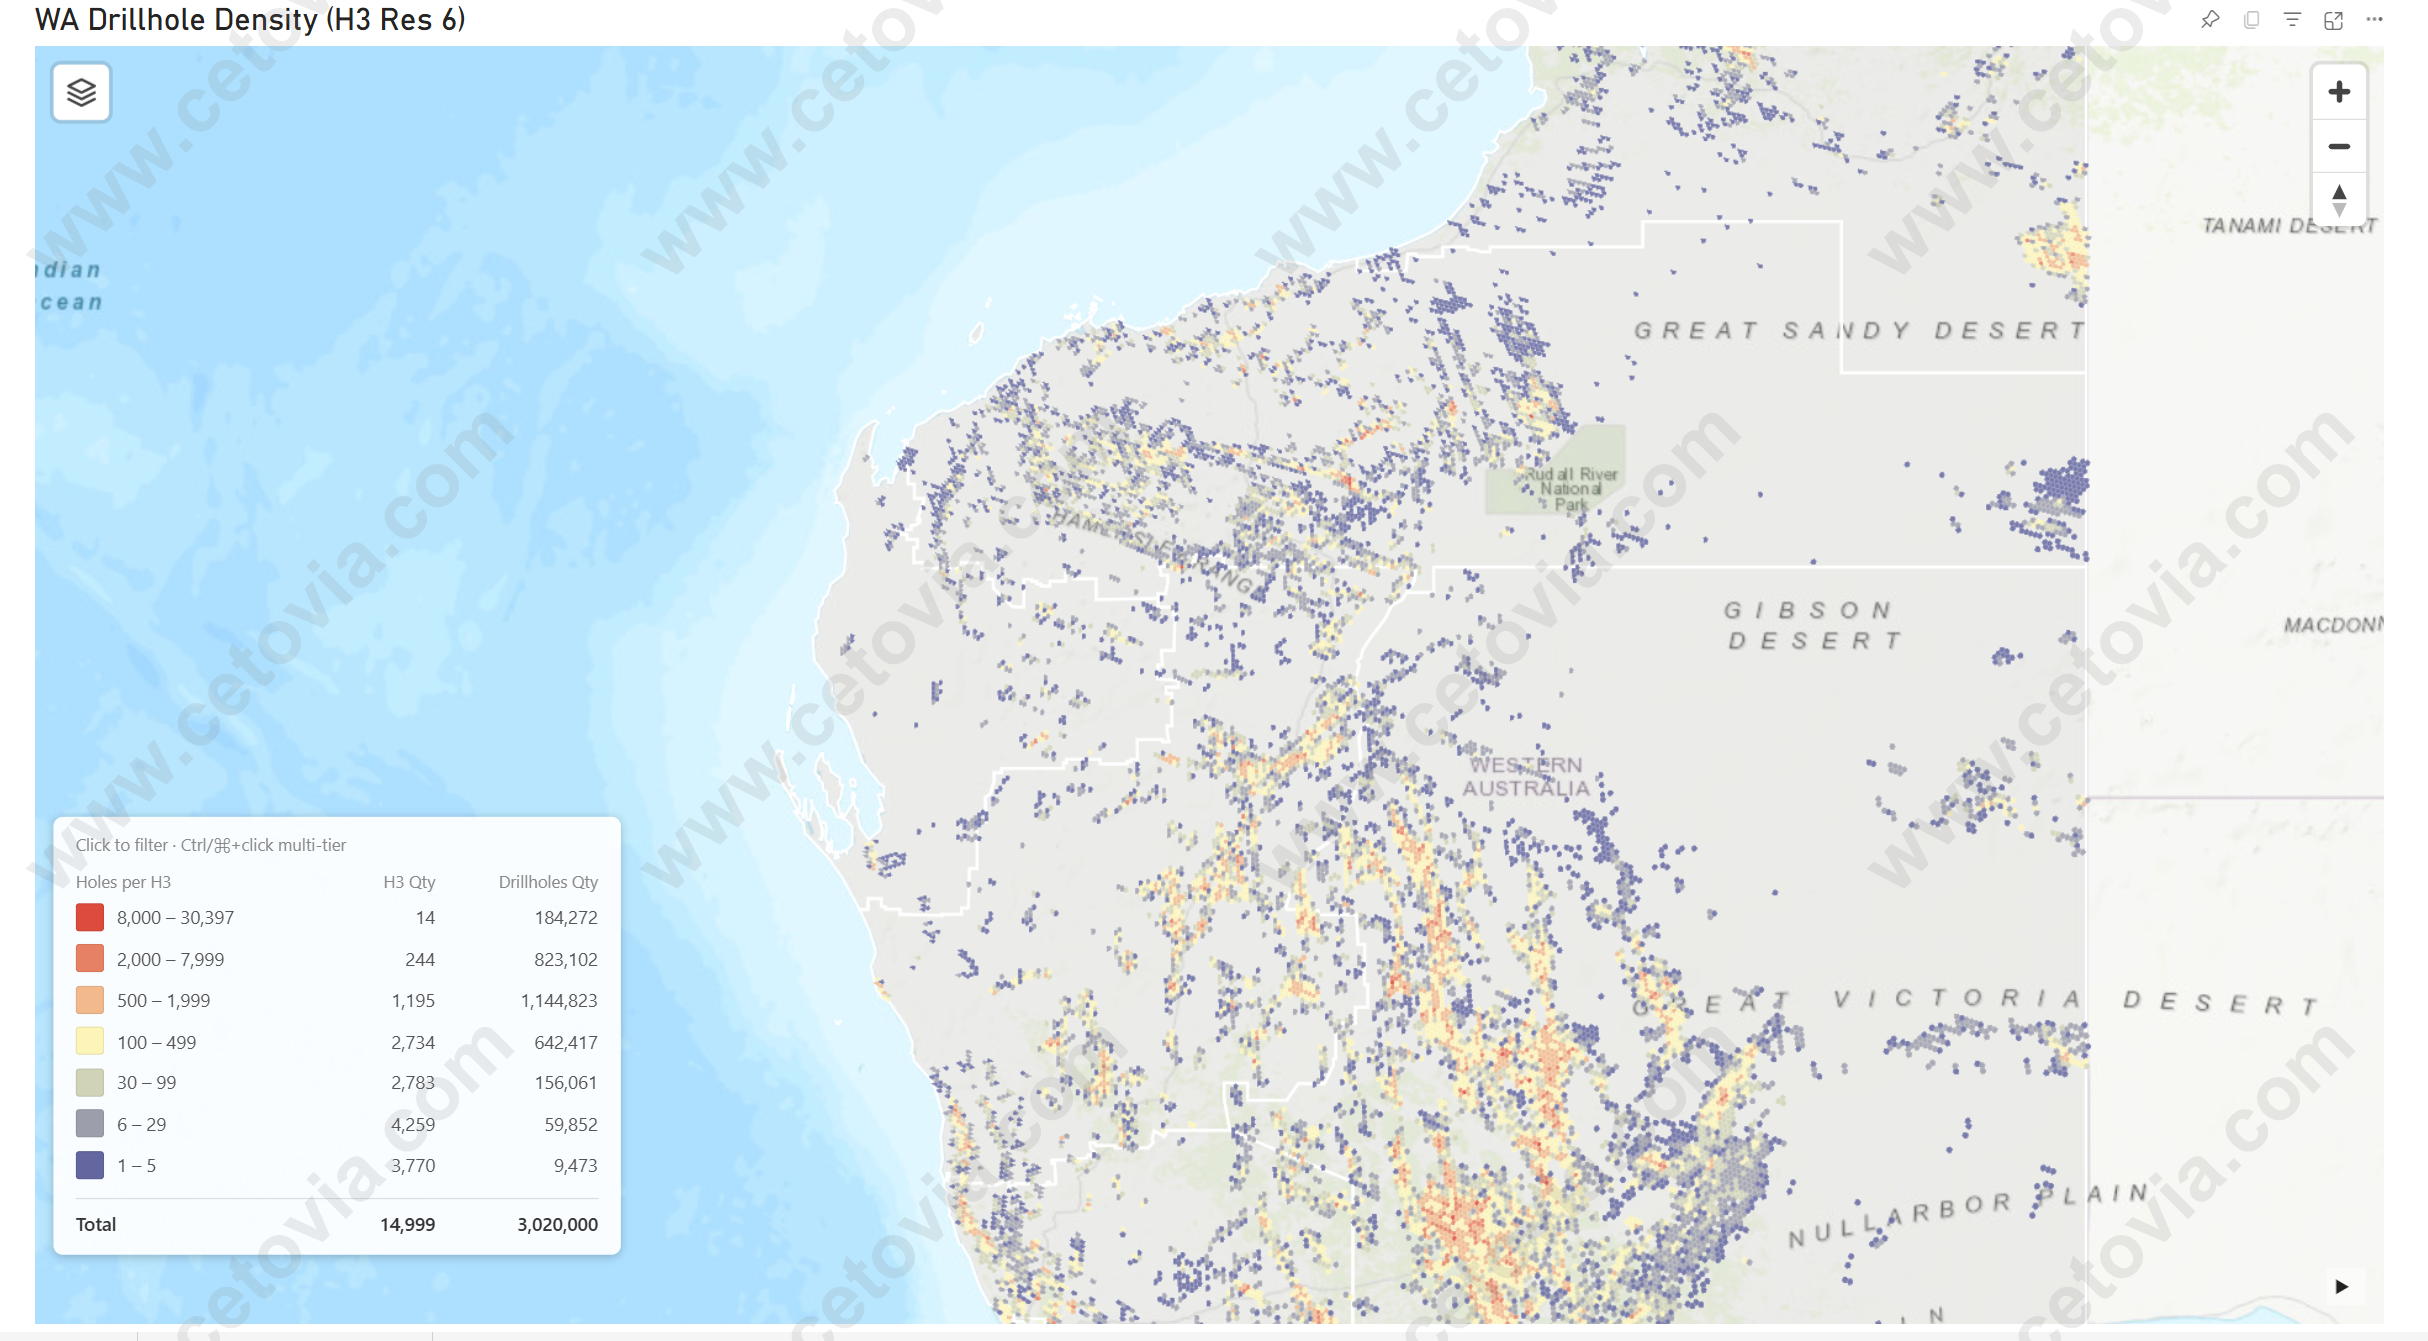
Geographic Heatmap
Advanced geospatial analysis with custom map layers
Other Custom Solutions
Unique visualization challenges require bespoke solutions
Built with Power BI SDK + D3.js + TypeScript
Why Choose Cetovia?
Deep technical expertise meets real-world industry experience — delivering Power BI solutions that move the needle.
Technical Depth
Deep expertise in DAX, M (Power Query), and D3.js — the three pillars of advanced Power BI.
Industry Experience
Proven track record across finance, manufacturing, retail, and healthcare sectors.
End-to-End Delivery
From requirements gathering to deployment and training — full lifecycle ownership.
Ongoing Support
Comprehensive training and continuous maintenance to ensure long-term success.
How We Work
Structured, transparent — from first call to long-term partnership.
Discovery & Requirements
Phase 1Deep dive into your business scenarios and technical requirements
Solution Design
Phase 2Architecture planning, technology selection, and prototype design
Development & Iteration
Core PhaseAgile development with regular check-ins and feedback loops
Testing & Deployment
Final PhasePerformance testing, UAT, and user training sessions
Continuous Optimization
OngoingMaintenance support and feature enhancements
Small-scale: 2-4 weeks • Mid-size: 6-12 weeks • Enterprise-grade: 12-24+ weeks
Ready to Unlock Your
Data's True Potential?
Let's discuss how we can transform your data visualization strategy.